HTM compared with standard detectors on grid emergencies
Texas (ERCOT), California (CAISO), Tennessee Valley (TVA) · hourly EIA-930 data, 2020-2026 · 5 target emergencies
Summary
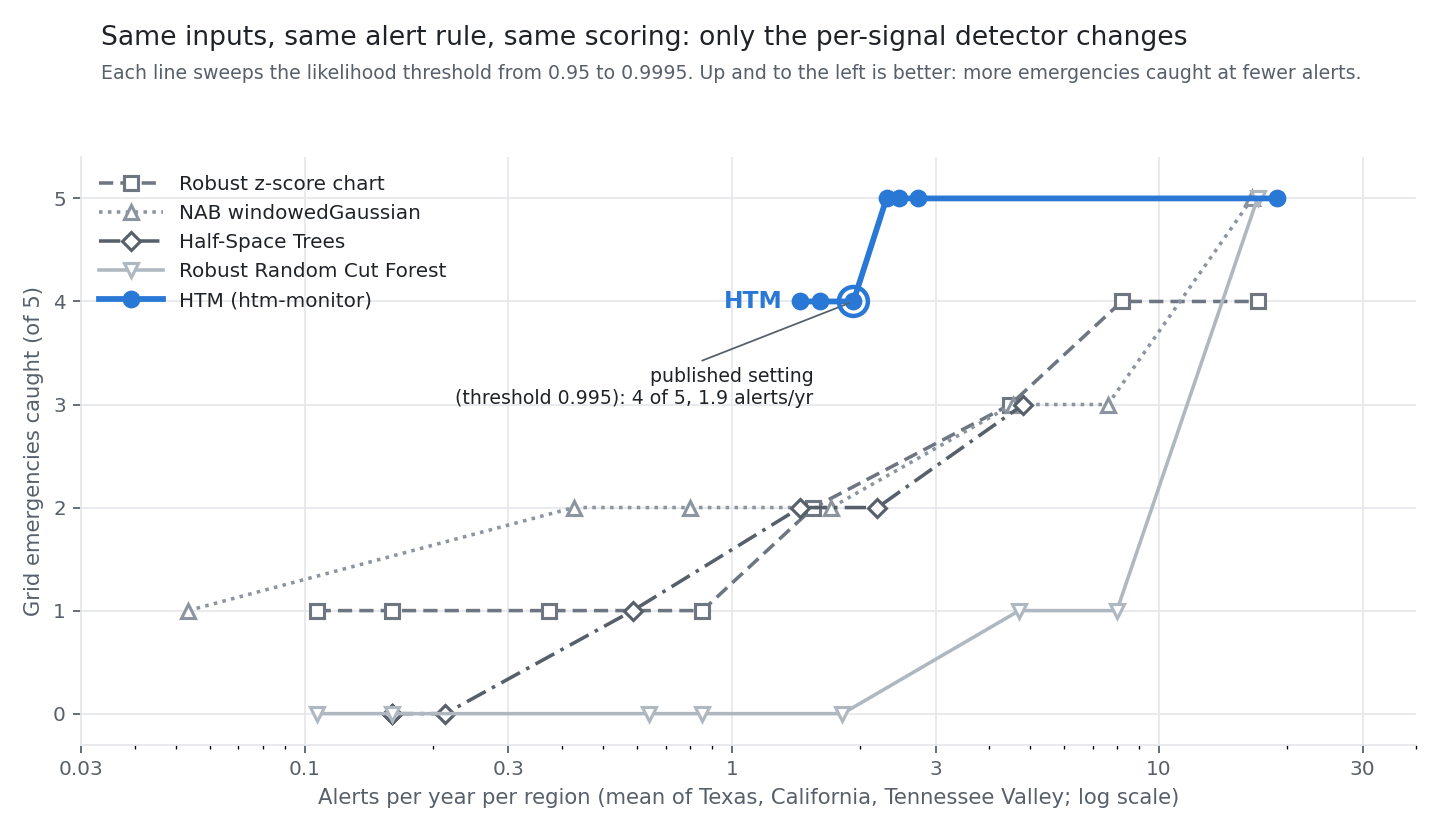
Within 3 alerts per year per region, HTM with grouped consensus catches 4.4 of 5 grid emergencies on average over 5 random seeds (range 4-5). The best of 13 standard detectors, given the same inputs, alert rule and scoring, catches 3.0 (fixed 2019 threshold); alerts fired at random times at that rate would catch about 0.4. At the published threshold (0.995) HTM catches 3.4 of 5 on average (range 2-4) with 1.7 alerts per year per region.
The claim is scoped to what was tested: HTM combined with the grouped consensus rule, against each baseline combined with the same rule. HTM's per-signal output alone, without the grouping, raises far too many alerts (see the checks below). Five events across three regions is a case study, not a detection rate.
What was held fixed
- Inputs. Every detector sees the same per-signal inputs HTM sees (
data/grid/<region>/): forecast error and seasonal anomalies of demand and net generation (CA also imbalance), on each run's own hourly timebase. - Alert rule. Each detector replaces HTM as the per-signal model; its scores go through the same grouped consensus rule (two signal groups must agree within 3 hours, 3-hour persistence, 8-hour warmth window).
- Score to probability. A baseline's raw score becomes a causal tail probability: the share of its own earlier scores at or below the current one. That is the same [0, 1] quantity HTM's anomaly likelihood gives, so one threshold applies to all.
- Scoring. Cited operator-declared onsets; an event counts if the first alert falls 168 h before to 48 h after onset. Every alert counts toward alerts per year, explained or not.
- No look-ahead. Everything fitted (encoder ranges, the fixed threshold, LSTM training) uses 2019 only, the year before scoring starts; every score at hour t uses data up to t.
- No tuning on events. Baselines run with library or paper defaults. Every method is swept over thresholds 0.95-0.9995, and the 'within 3 alerts per year' comparison picks each method's best threshold the same way.
- Seeds. HTM and every baseline with randomness (both LSTMs, Half-Space Trees, the two joint models) run with 5 seeds; tables report the mean and range.
The detectors
One or more per family a reviewer would expect, all online, causal and unsupervised, as HTM is.
| Detector | Family | Setup | Why it is here | Reference |
|---|---|---|---|---|
| HTM (htm-monitor) | Sequence memory | One HTM model per signal (encoder, Temporal Memory, anomaly likelihood), learning online from the first hour | The method under test | Ahmad et al. 2017, Neurocomputing 262 |
| Operator rule | Simple rule | Alert when demand exceeds the day-ahead forecast by more than the trailing year's q-quantile of percent error, for 3 hours | What a grid operator could set up without any model | - |
| Fixed 2019 threshold | Simple rule | Each signal's |value| ranked against its 2019 values; frozen after 2019 | Tests whether the inputs alone carry the result | - |
| Robust z-score chart | Statistical process control | |x - median| / MAD over the previous 720 h | The classic control chart, on a robust scale | ISO 7870-2 |
| CUSUM chart | Statistical process control | Two-sided tabular CUSUM on the robust z, k = 0.5, h = 5 | Built for slow drifts such as multi-day build-ups | Page 1954; Montgomery, Introduction to SQC |
| EWMA chart | Statistical process control | EWMA of the robust z, lambda = 0.2 | Smoothed control chart, sensitive to small sustained shifts | Roberts 1959 |
| NAB windowedGaussian | Anomaly benchmark baseline | |x - mean| / sd over the previous 6400 points | The baseline in Numenta's own anomaly benchmark | Lavin & Ahmad 2015 (NAB) |
| Matrix Profile discord | Time-series data mining | Distance from the latest 24 h to its nearest earlier 24 h (left matrix profile, STUMPY) | Parameter-light discord detection, strong in recent benchmarks | Yeh et al. 2016, ICDM |
| LSTM forecaster, trained on 2019 | Deep sequence learning | 2-layer LSTM (64 units) predicts the next hour from 24 h; score = absolute error; trained on 2019, then frozen | The standard deep sequence-learning detector (LSTM-AD) | Malhotra et al. 2015, ESANN |
| LSTM forecaster, retrained quarterly | Deep sequence learning | Same model, fine-tuned every 2190 h on the trailing year seen so far | Answers 'a frozen model will drift'; learns continuously, as HTM does | - |
| Half-Space Trees | Streaming ML | river defaults (10 trees, height 8, window 250), shingle of 4 | Standard streaming anomaly forest | Tan, Ting & Liu 2011, IJCAI |
| Robust Random Cut Forest | Streaming ML | 40 trees, tree size 256, shingle of 4; collusive displacement | The forest used in AWS streaming analytics (Kinesis RANDOM_CUT_FOREST) | Guha et al. 2016, ICML |
| Half-Space Trees, all signals jointly | Streaming ML, multivariate | One model over all of a region's signals (4-hour shingles), single-group rule | Tests whether HTM's grouping matters | Tan, Ting & Liu 2011 |
| RRCF, all signals jointly | Streaming ML, multivariate | One model over all of a region's signals (4-hour shingles), single-group rule | Tests whether HTM's grouping matters | Guha et al. 2016 |
Results
| Detector | Seeds | Caught at 0.995 | Alerts / yr / region | Best caught within 3 alerts / yr |
|---|---|---|---|---|
| HTM (htm-monitor) | 5 | 3.4 (2-4) | 1.7 | 4.4 (4-5) |
| Fixed 2019 threshold | 1 | 3.0 | 1.1 | 3.0 |
| LSTM forecaster, trained on 2019 | 5 | 1.0 | 0.6 | 2.8 (2-3) |
| Half-Space Trees | 5 | 0.4 (0-1) | 0.3 | 2.4 (2-3) |
| Half-Space Trees, all signals jointly | 5 | 4.0 (2-5) | 8.2 | 2.0 (1-4) |
| NAB windowedGaussian | 1 | 2.0 | 0.8 | 2.0 |
| LSTM forecaster, retrained quarterly | 5 | 1.2 (1-2) | 0.7 | 2.0 |
| Robust z-score chart | 1 | 1.0 | 0.9 | 2.0 |
| EWMA chart | 1 | 1.0 | 0.9 | 2.0 |
| Operator rule | 1 | 1.0 | 9.6 | 1.0 |
| CUSUM chart | 1 | 1.0 | 0.3 | 1.0 |
| RRCF, all signals jointly | 5 | 2.4 (1-4) | 5.8 | 0.6 (0-1) |
| Matrix Profile discord | 1 | 0.0 | 0.0 | 0.0 |
| Robust Random Cut Forest | 1 | 0.0 | 0.9 | 0.0 |
| Alerts at random times | - | - | 3 | 0.4 |
Means over seeds, with the range in brackets. Some methods catch more at the published threshold only by alerting far more often (the joint Half-Space Trees catches about 4 at over 8 alerts per year per region); matching the alert rate, as the last column does, is the fair comparison.
Per event
| HTM, 5 seeds | Uri (TX) | Aug 2020 (CA) | Sep 2020 (CA) | Sep 2022 (CA) | Elliott (TVA) |
|---|---|---|---|---|---|
| Seeds that caught it | 5 of 5 | 3 of 5 | 3 of 5 | 1 of 5 | 5 of 5 |
| Lead / lag when caught | 99-103 h ahead | 22 h ahead to 3.4 h after | 7.9-22 h ahead | 9.7 h after | 6.8-7.8 h after |
Uri and Elliott are caught by every seed. The California events sit near the threshold: each is caught by some seeds and missed by others. August 2020 was mainly a supply-side shortfall after solar drop-off, which EIA-930 does not show directly.
| Published run (seed 42) | Uri (TX) | Aug 2020 (CA) | Sep 2020 (CA) | Sep 2022 (CA) | Elliott (TVA) |
|---|---|---|---|---|---|
| HTM (htm-monitor) | Predicted 103 h ahead | Missed | Predicted 21 h ahead | Detected 9.7 h after | Detected 7.8 h after |
| Fixed 2019 threshold | Predicted 6.3 h ahead | Detected 2.4 h after | Missed | Missed | Detected 15 h after |
| LSTM forecaster, trained on 2019 | Detected 3.7 h after | Missed | Missed | Missed | Missed |
| Half-Space Trees | Missed | Missed | Missed | Missed | Missed |
| Half-Space Trees, all signals jointly | Predicted 83 h ahead | Missed | Predicted 142 h ahead | Missed | Missed |
| NAB windowedGaussian | Detected 3.7 h after | Missed | Missed | Missed | Detected 21 h after |
| LSTM forecaster, retrained quarterly | Predicted 5.3 h ahead | Missed | Missed | Missed | Missed |
| Robust z-score chart | Predicted 85 h ahead | Missed | Missed | Missed | Missed |
| EWMA chart | Predicted 84 h ahead | Missed | Missed | Missed | Missed |
| Operator rule | Predicted 140 h ahead | Missed | Missed | Missed | Missed |
| CUSUM chart | Predicted 85 h ahead | Missed | Missed | Missed | Missed |
| RRCF, all signals jointly | Detected 6.7 h after | Predicted 27 h ahead | Missed | Missed | Missed |
| Matrix Profile discord | Missed | Missed | Missed | Missed | Missed |
| Robust Random Cut Forest | Missed | Missed | Missed | Missed | Missed |
Robustness checks
Each check re-scores existing outputs; the number is the mean best catch within 3 alerts per year per region.
| Question | HTM | Best baseline | Reading |
|---|---|---|---|
| Is it a lucky seed? | 4.4 (4-5) | 3.0 | HTM's worst seed beats every baseline's mean |
| Is it the grouped rule? (all signals in one group, any one fires) | 0.0 | 3.0 (NAB windowedGaussian) | Without groups HTM floods (65.7 alerts / yr at 0.995); the result is HTM and the rule together |
| Is it HTM's anomaly-likelihood step? (given to every baseline) | 4.4 | 3.0 (LSTM forecaster, trained on 2019) | No baseline rises above the result without it |
| Would a retrained LSTM do better? | 4.4 | 2.0 | Retraining quarterly scores 2.0, against 2.8 frozen |
| Do the scoring windows decide it? 72 h / 24 h | 3.4 | 3.0 | Uri's ~100 h warning counts as too early here |
| 336 h / 72 h | 4.4 | 3.0 | HTM leads at every window tried |
Questions about the comparison
Why these detectors?
One or more per family a reviewer expects: simple operator rules, statistical process control, Numenta's own benchmark baseline, streaming machine learning, time-series data mining, deep sequence learning, and joint models over all signals. All meet the same constraints as HTM: online, causal, unsupervised, no labels.
Were the baselines tuned?
No; they use library or paper defaults, as HTM uses its shared defaults. Every method is swept across thresholds, so none is judged at one setting. A per-method hyperparameter grid is listed under next steps.
There are many ways to build an LSTM.
True of every baseline: no comparison shows HTM beats every possible implementation. The LSTM here is the standard LSTM-AD design; a version retrained every quarter, to answer 'a frozen model drifts', did not do better. The claim is scoped to these implementations.
Was the alert rule designed for HTM?
Yes, and it matters: HTM needs the grouped rule, and the baselines given the same rule still trail it. Under the simplest rule (no groups) every method does poorly and HTM floods. The finding is that HTM's frequent per-signal alerts become precise once two signal groups must agree.
Is it luck?
Every random method ran with 5 seeds; HTM's worst seed still beats every baseline's mean. Alerts at random times at 3 per year would catch about 0.4 of 5.
Five events is tiny.
Agreed. It is a case study across three regions, with every alert published; the seed spread and the chance baseline are the honest error bars.
Why not Transformers or TranAD?
They need a training split and substantial tuning; the LSTM represents deep forecasting detectors here. Adding one is a reasonable next step.
Do the explanatory labels flatter HTM?
No. Alerts per year counts every alert, explained or not.
Limits and next steps
- Five target events in three regions; California results depend on the seed.
- The inputs and the alert rule were developed with HTM; baselines inherit them unchanged.
- Per-signal RRCF ran with one seed (about 15 hours of computing per extra seed; it catches none at the published setting).
- Next: a small hyperparameter grid for the strongest baselines; a Transformer forecaster; supply-side signals for California; a second domain.