Use Cases
Scored Against
Real Grid Emergencies
htm-monitor has been replayed over about six years of public grid data per region and scored against documented emergencies. Here is what it found, including the alerts that matched nothing.
Power Grid Monitoring
Early warning of grid emergencies from hourly demand and generation data
How these results are scored
- One standard for every event. An event is Predicted if the first alert falls within 168 hours before onset, Detected if it falls within 48 hours after onset, and Missed otherwise. The reasoning is in “Too early is the same as wrong”.
- Onset has a source. Onset is the time the grid operator declared the highest emergency level the event reached, converted to UTC. Each event row links to the document that states the time.
- Every alert is counted. Consecutive alerting hours count as one alert. A later alert inside a target window is a repeat: no credit, no penalty. An alert outside every target window is “explained” if it starts inside an explanatory window declared in the run config, and “unexplained” otherwise. Explained is a hindsight label and never counts as a catch, so both rates are shown.
- Timing is a replay, not live operation. Alert times are the UTC hour-ending stamps of EIA-930 hourly data, and the replay treats each value as available at its stamp. EIA publishes demand about an hour later and net generation the next day, so live use at these lead times needs the operator’s own telemetry.
- This is a case study. Five target events across three regions show how the detector behaves, not a detection rate.
Texas (ERCOT)
The Events
- Winter Storm Uri (February 2021) forced ERCOT into rotating outages that peaked at 20,000 MW of load shed. More than 4.5 million customers lost power.
- The run models three hourly signals: demand and net generation, each as its departure from the same hour over the previous four weeks, and forecast error (demand minus the day-ahead demand forecast).
Results at a Glance
- Predicted 1 of 1 target event, alert before onset: Uri (103 h lead)
- 0 missed target events
- 17 alerts over 6.2 years of hourly data: 1 first alert on a target event, 1 repeat inside a target window, and 15 outside every target window
- Explained 4 of those 15 start inside an explanatory window declared in the run config: COVID-19 demand shift, Apr to Jun 2020; Winter Storm Elliott, Dec 2022; Winter Storm Heather, Jan 2024; Winter Storm Kingston, Feb 2025. That is a hindsight label, not a catch.
- 11 unexplained alerts (1.8 per year, or 2.4 per year counting the explained ones)
Event Summary
| Event | Outcome | Lead / Lag | First Alert (UTC) | Onset (UTC) |
|---|---|---|---|---|
| Winter Storm Uri Rotating outages, up to 20,000 MW of load shed |
Predicted | 103 h lead | 2021-02-11 00:00 | 2021-02-15 07:20 ERCOT entered Emergency Operations Level 3 (EEA 3) and began rotating outages · source |
California (CAISO)
The Events
- August 2020: CAISO ordered rotating outages on two consecutive evenings, the first in California since 2001, affecting about 813,000 customers.
- September 2020 and September 2022: heat waves pushed CAISO to Stage 2 and EEA 3 emergencies. No outages were ordered by CAISO in either.
- The run models five hourly signals: demand, net generation and imbalance (demand minus net generation), each as its departure from the same hour over the previous four weeks; imbalance itself; and forecast error.
Results at a Glance
- Predicted 1 of 3 target events, alert before onset: Sep 2020 heat wave (21 h lead)
- Detected 1 of 3 target events, alert within 48 h after onset: Sep 2022 record demand (9.7 h lag)
- Missed 1 of 3 target events: Aug 2020 blackouts
- Aug 2020 blackouts: Missed. The demand and generation models were strongly anomalous from about 25 hours before the Stage 3 declaration, but no residual signal (forecast error, imbalance) agreed, so the two-group rule did not fire. An earlier version caught this event only through an imbalance feature normalized with hour-of-day medians from the whole 2020-26 period, which used future data; with that feature made causal, the event is missed.
- 9 alerts over 6.2 years of hourly data: 2 first alerts on target events, 1 repeat inside a target window, and 6 outside every target window
- Explained 1 of those 6 starts inside an explanatory window declared in the run config: COVID-19 demand shift, Apr to May 2020. That is a hindsight label, not a catch.
- 5 unexplained alerts (0.8 per year, or 1.0 per year counting the explained ones)
Event Summary
| Event | Outcome | Lead / Lag | First Alert (UTC) | Onset (UTC) |
|---|---|---|---|---|
| August 2020 Rolling Blackouts Stage 3 Emergency, rotating outages on Aug 14 and 15 |
Missed | — | — | 2020-08-15 01:38 CAISO declared a Stage 3 Emergency · source |
| September 2020 Labor Day Heat Wave Stage 2 Emergency, no outages ordered |
Predicted | 21 h lead | 2020-09-06 04:00 | 2020-09-07 00:55 CAISO declared a statewide Stage 2 Emergency · source |
| September 2022 Record Demand EEA 3 declared, no load shed ordered by CAISO |
Detected | 9.7 h lag | 2022-09-07 10:00 | 2022-09-07 00:17 CAISO declared an EEA 3 · source |
Tennessee Valley (TVA)
The Events
- Winter Storm Elliott (December 2022) forced TVA into the first rolling blackouts in its history, with firm load shed of up to 3,000 MW on December 23 and 24.
- The run models three hourly signals, the same as Texas: demand and net generation as departures from the same hour over the previous four weeks, and forecast error.
Results at a Glance
- Detected 1 of 1 target event, alert within 48 h after onset: Elliott (7.8 h lag)
- 0 missed target events
- 10 alerts over 6.2 years of hourly data: 1 first alert on a target event, 1 repeat inside a target window, and 8 outside every target window
- 8 unexplained alerts (1.3 per year)
Event Summary
| Event | Outcome | Lead / Lag | First Alert (UTC) | Onset (UTC) |
|---|---|---|---|---|
| Winter Storm Elliott EEA 3, first rolling blackouts in TVA's history |
Detected | 7.8 h lag | 2022-12-23 19:00 | 2022-12-23 11:12 TVA declared EEA 3 · source |
Compared with other detectors
Thirteen standard detectors, from operator rules and control charts to streaming forests and LSTMs, were each put in HTM's place with the same inputs, alert rule and scoring. Within 3 alerts per year per region, HTM catches 4.4 of 5 emergencies on average over 5 random seeds; the best baseline catches 3.0, and random alerts about 0.4.
| Detector | Caught within 3 alerts / yr | Caught at published threshold | Alerts / yr / region |
|---|---|---|---|
| HTM (htm-monitor) | 4.4 (4-5) | 3.4 (2-4) | 1.7 |
| Fixed 2019 threshold | 3.0 | 3.0 | 1.1 |
| LSTM forecaster, trained on 2019 | 2.8 (2-3) | 1.0 | 0.6 |
| LSTM forecaster, retrained quarterly | 2.0 | 1.2 (1-2) | 0.7 |
| 10 other detectors | at most 2.4 |
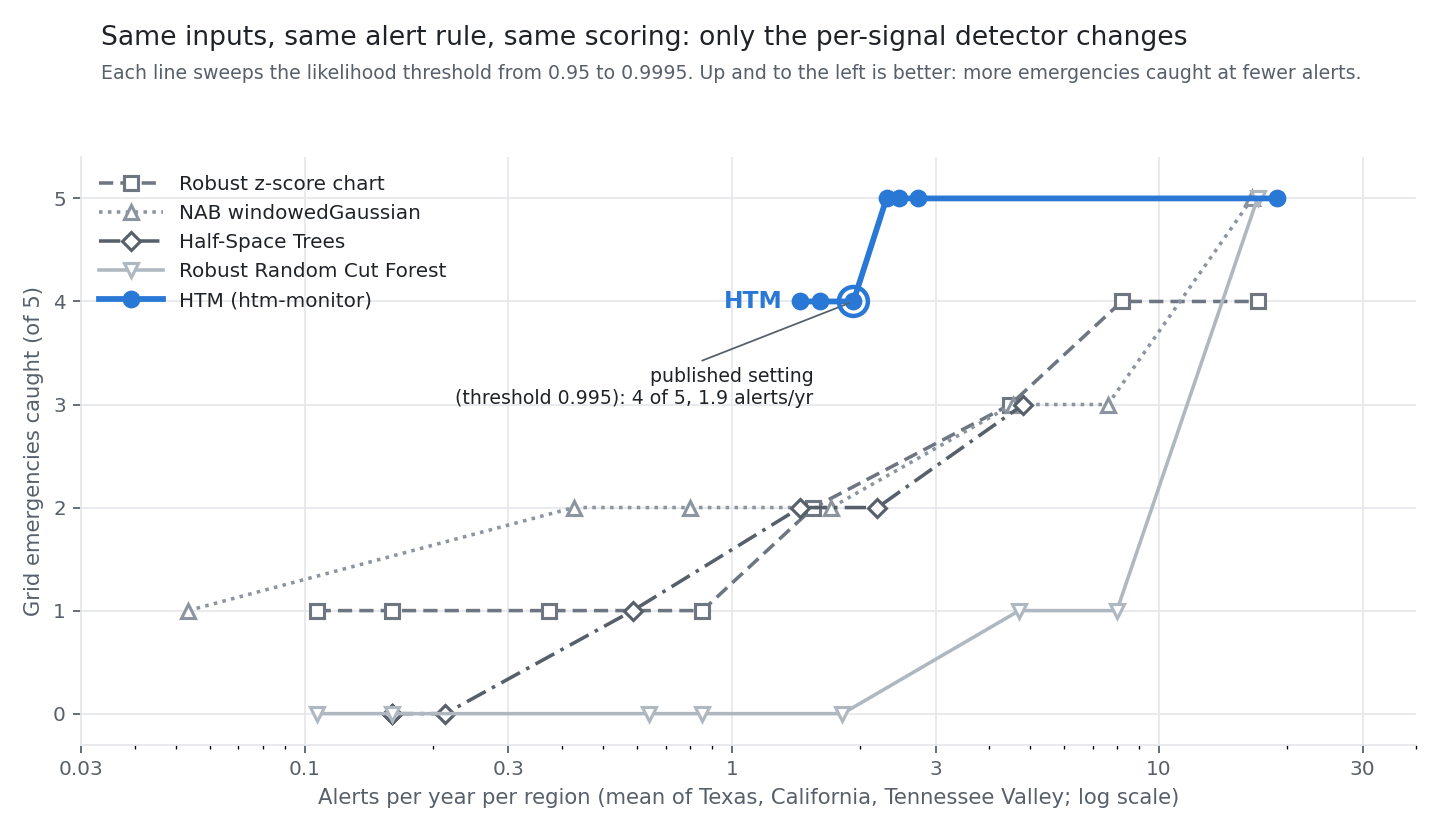
Means over 5 seeds, range in brackets. The result is HTM and the grouped rule together; five events is a case study.
Full comparison: every detector, seeds, robustness checks and limits →